
Overview
Data analysis provides insights from raw data which is used to support decision-making. Microsoft Excel is a simple, powerful, and one of the top tools for data analysis. This comprehensive guide will introduce you to the concepts of data analysis and present practical examples using Microsoft Excel.
Introduction
Data analysis has emerged as an important field because it provides the ability to analyze data which helps people in making better decisions. Data analysis is the process of collecting, modeling, and analyzing, and exploring data to find a pattern in it.
Table of Contents
- What is Data analysis?
- Data analysis with Microsoft Excel
- Essential keyboard Shortcuts for Excel Data Analysis
- Download data set
- Sort, Filter, Conditional, Formatting, and Charts
- Create a Pivot table for a data set
- Tables, What-If Analysis and Quick Analysis
- Analysis ToolPak
- Other tools for data analysis
- Conclusion
- End Notes
What is Data analysis?
Data analysis is the process of Data Requirement Gathering (What type of data do you want to use and how do you plan to analyze it), Data Collection (Collect the data from available sources), Data Cleaning (The data we collected are not always in ideal form so we have to remove white spaces, duplicate records, null values, and basic errors. it is mandatory to clean data before uses for analysis), Data Analysis (In this step we uses data analysis software’s and other tools to interpret the data and get insights on data), Data Interpretation (We need to interpret them and give the best findings from that) and data visualization (Display your data using graph and charts so that people can read and understand it easily).
There are two main methods of Data Analysis: qualitative analysis and quantitative analysis. There are many other techniques available like Statistical analysis, Text analysis, Diagnostic analysis, Predictive analysis, Prescriptive Analysis, etc.
Data analysis with Microsoft Excel
Microsoft Excel provides powerful features and ways to interpret and analyze data. The data can be collected from various sources. Then that data can be converted and formatted in several ways according to user need. It can be analyzed with the relevant Excel commands, statistical functions, and tools – Sort, Filter, Ranges, Tables, Conditional Formatting, Date functions, Time functions, Subtotals, Quick Analysis, What-if Analysis, Solvers, Pivot Tables, Charts, and Analysis ToolPak, etc.
Essential keyboard Shortcuts for Excel Data Analysis
1. Alt + A + T or Alt + D+ F +F : To add or remove Filters
2. Ctrl + Pg Up/Pg Dn : Shift between sheets
3. Alt + A + S + S : To sort data
4. Ctrl + Spacebar : Select entire column
5. Shift + Spacebar : Select entire row
6. Ctrl + Shift + Down/Right : Select till the last non-empty cell in column/row
7. Ctrl + 0 : To hide columns
8. Ctrl + Shift + ) or Alt + O + C + U : To Unhide columns
9. Ctrl + 9 : To hide rows
10. Ctrl + Shift + ( : To Unhide rows
11. Alt + W + F + R : To freeze top row
Download data set
Download Supermarket sales data set from Kaggle using the below link:
https://www.kaggle.com/aungpyaeap/supermarket-sales
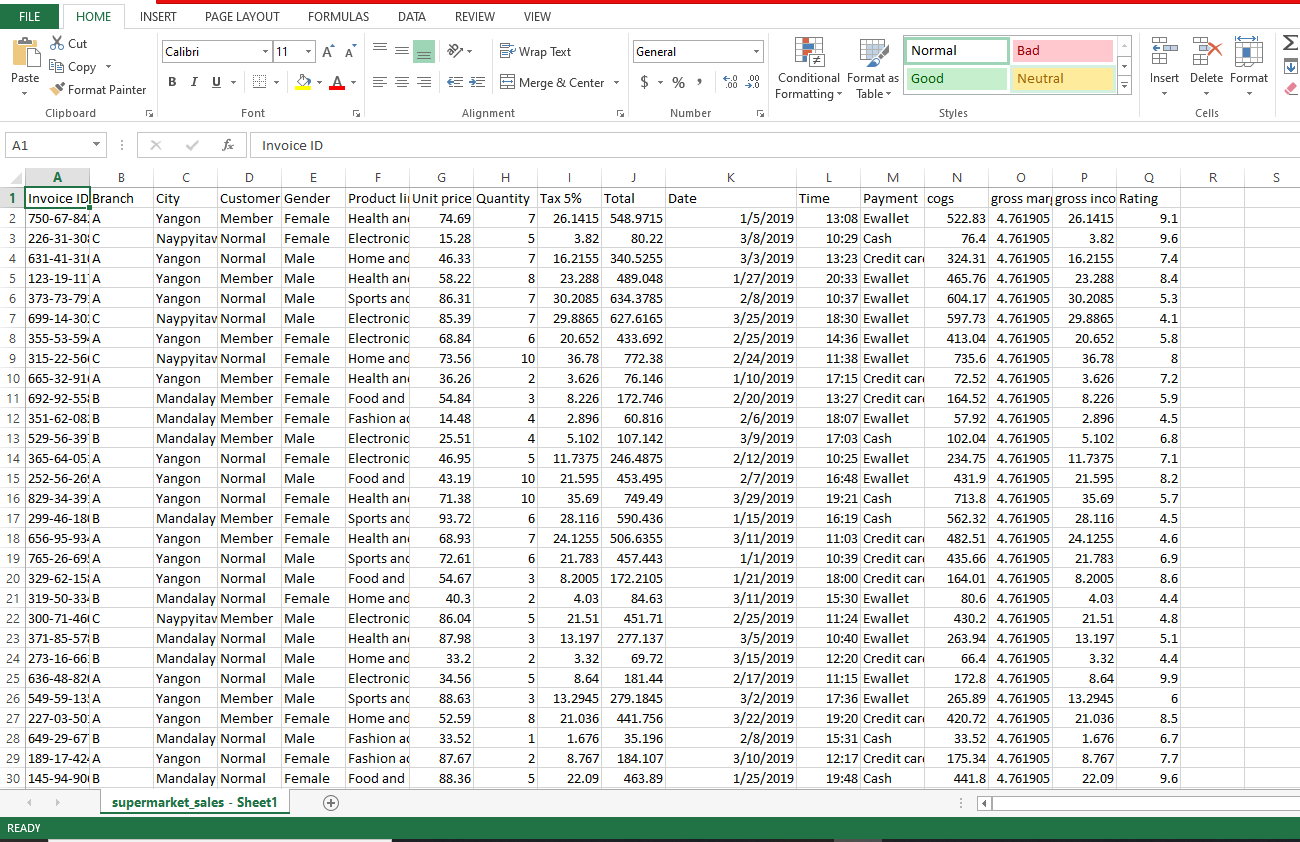
The growth of supermarkets is increasing and market competition is also high. The given dataset shows the historical sales of a Supermarket Company which has recorded data for 3 months in 3 different branches of the Supermarket. We are going to analyze this dataset with Microsoft Excel. Open supermarket_sales – Sheet1 file in MS Excel. We can also check the Attribute information of this sheet on the Kaggle site.
This data set is already clean and validated so we don’t have to perform any data cleaning and validation steps on it. Before analyzing always check that only valid values are in cells, there are no missing or null values and data is in the proper format.
Sorting in Excel:
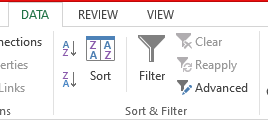
We can sort our Excel data based on one or multiple columns. We can sort in ascending or descending order or sort data in a custom order. We can also sort data by color. We can use Alt + A + S + S shortcut to directly sort data or select the sort icon from the Data menu as shown below.
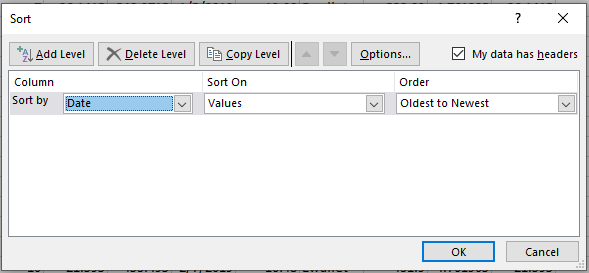
In the below example we sort data according to the Date column and the order is ascending. We can also sort data according to different columns and different orders. For example, if we want to check data rating wise we can sort data according to the rating column. From this, we can find out the highest and lowest-rated products and branches ratings.
Filtering in Excel:
We can filter our data and can only display records that we need for analysis. We can use Alt + A + T shortcut to directly Filter data or select the Filter icon from the Data menu as shown below. We can also apply a number filter to display numbers in a certain range or greater than, less than, or equal to the selected limit We can also apply a text filter to display records that begin with a specific character, end with a specific character, contain or do not contain a specific character, etc. To apply a number filter or text filter Click the arrow next to the heading row. For example, if we want to display only branch A’s data, then select only branch A from the filter box.

Conditional Formatting:
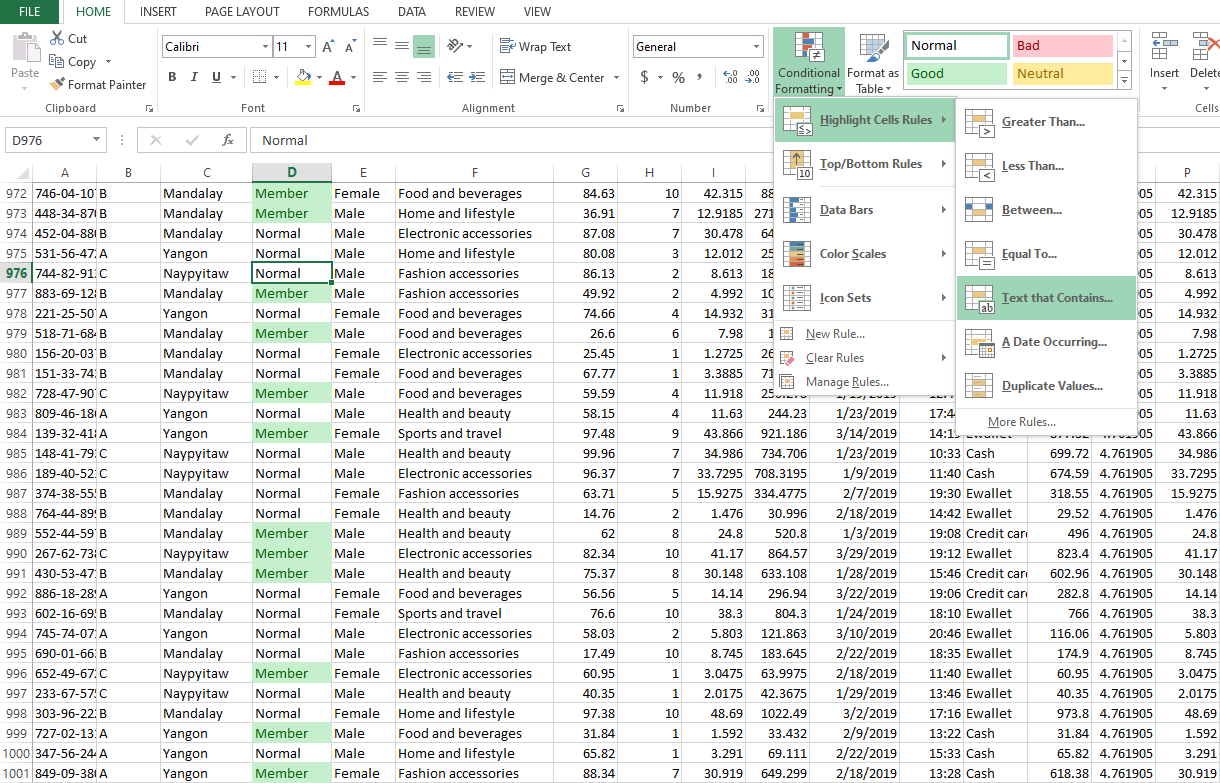
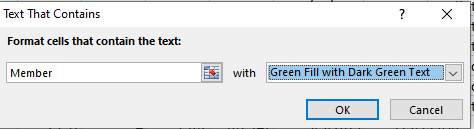
Conditional formatting in Excel allows you to identify duplicates in a dataset, highlight cells with a value greater/less than a number, highlight top/bottom 10 (or 10%), highlight errors/blanks, create Heat Maps, highlight every other row/column to increase the readability of the data, search and highlight data using Conditional Formatting. For example, if we want to highlight only members in customer type, first select the customer type column then Go to Home –> Conditional Formatting –> Highlighting Cell Rules –> Text that Contains. A dialogue box would open, in the dialogue box enter the value and select the color for highlighting cells.
Charts in Excel:
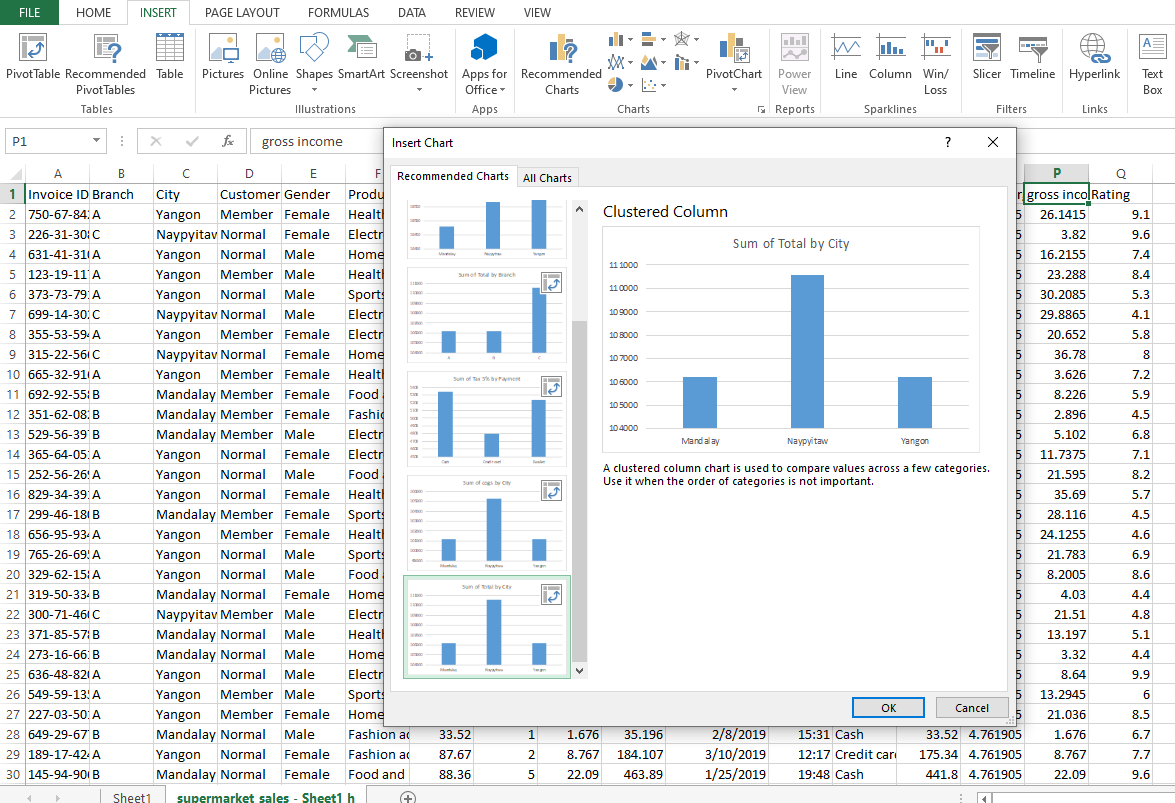
A simple Excel chart can be worth a thousand words of description. Concepts that are difficult to understand with sheets full of numbers can be easily displayed with charts or plots. To create a chart, Select data first then on the Insert tab in the Charts group click the chart symbol you want. There are different types of charts like Column Charts, Line Chart, Pie Chart, Bar Chart, Area Chart, Scatter Plot, Data Series, Axes, Chart Sheet, Trendline, Error Bars, Sparklines, Combination Chart, Gauge Chart, Thermometer Chart, Gantt Chart, Pareto Chart available in Excel.
Create a Pivot table for a data set:
The Pivot Table feature is a powerful tool that allows us to summarize huge amounts of data. You can use a PivotTable to analyze numerical data in detail (summarize data as averages, sums, or counts), and answer unanticipated questions about your data.it is mostly used to understand and find patterns in the data set.
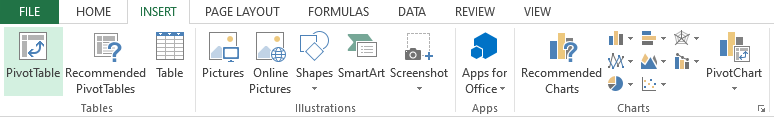
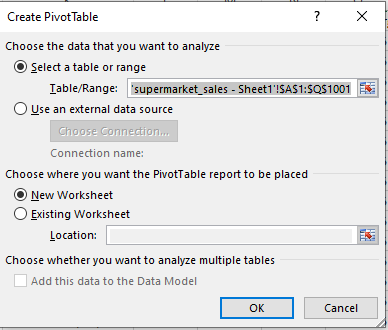
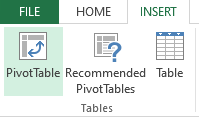
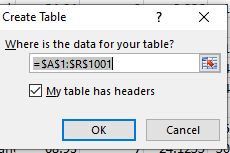
Here, we’ll use it to find out the Gross income of each Branch for General items like Electronic accessories, Fashion accessories, Food and beverages, Health and beauty, Home and lifestyle, sports, and travel. First, select table from supermarket_sales – Sheet1, so they are highlighted. Then from the Insert menu select PivotTable. In the dialogue box that appears, make sure the Table/Range radio button is selected and the accompanying text box reads ‘supermarket_sales – Sheet1′!$A$1:$Q$1001’.At the bottom of the dialogue box, make sure the New Worksheet radio button is highlighted, then click OK.
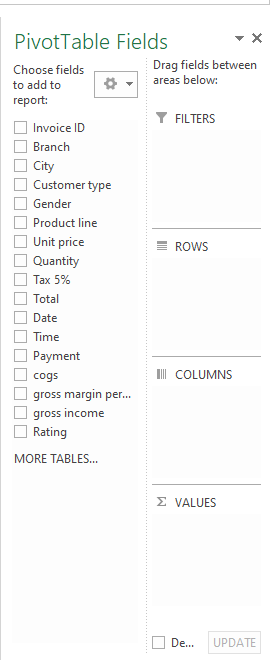
Now add Branch in Columns, product line in Rows gross income in values that shows the sum of gross income and generate table shown below from which we can know the total gross income of different branch for different products.
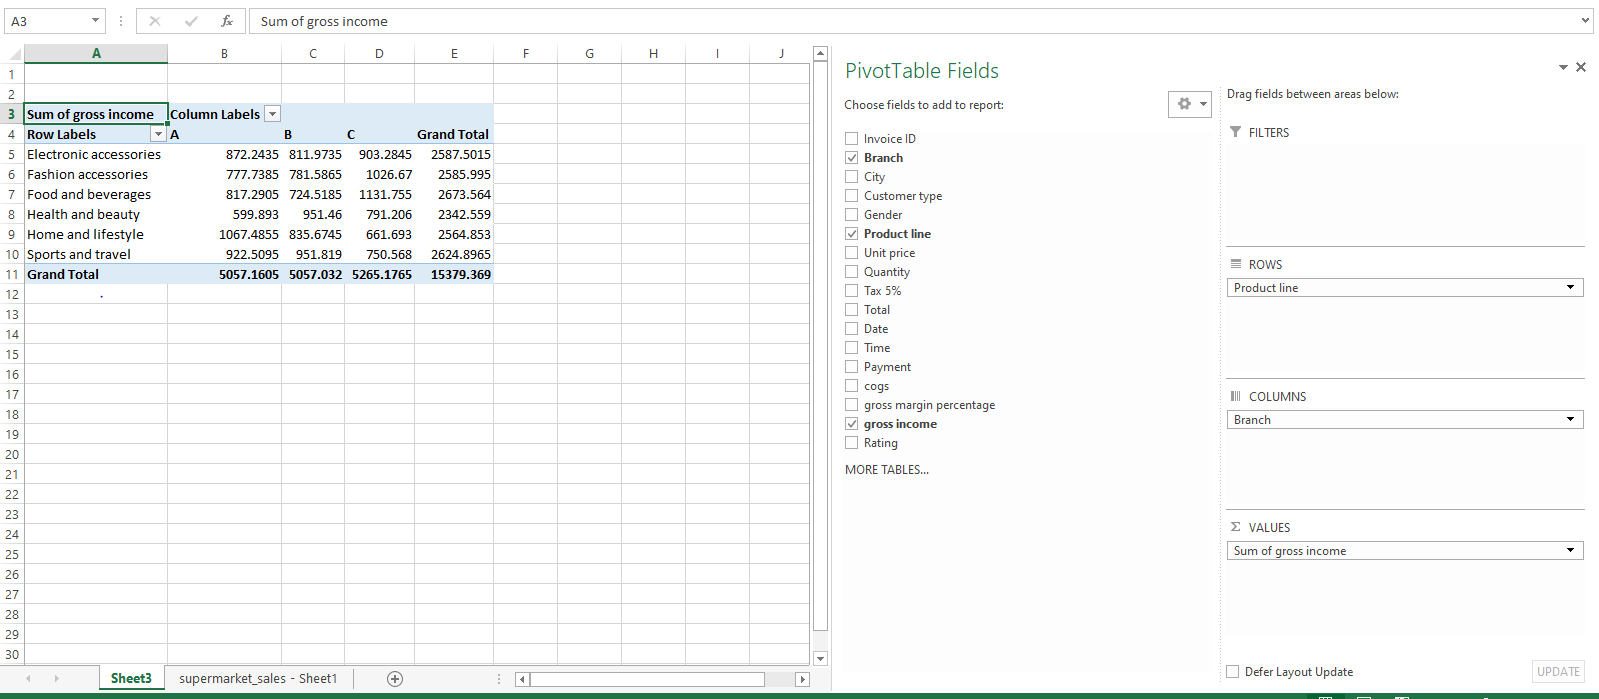
We can also add a graph for this table. Just select the type of graph from the Insert menu. We select the bar chart. From this chart, we can easily find out the highest and lowest gross income for different branches.
From this pivot table and bar chart, we can gain general insights like food and beverages have high gross income than other categories. The amount of gross income is very similar in all Branches with a slight increase in Branch C.
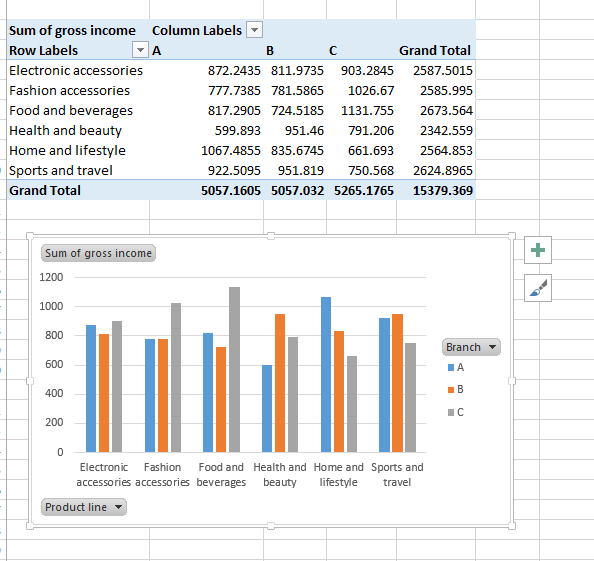
Just like this pivot table, we can create different types of pivot tables based on the information we need from the data. In the below example select the columns as shown in the below figure. After creating the pivot table select a line graph. From this Pivot table and graph, we can say that Women generate higher sales when compared to men.
Tables in Excel:
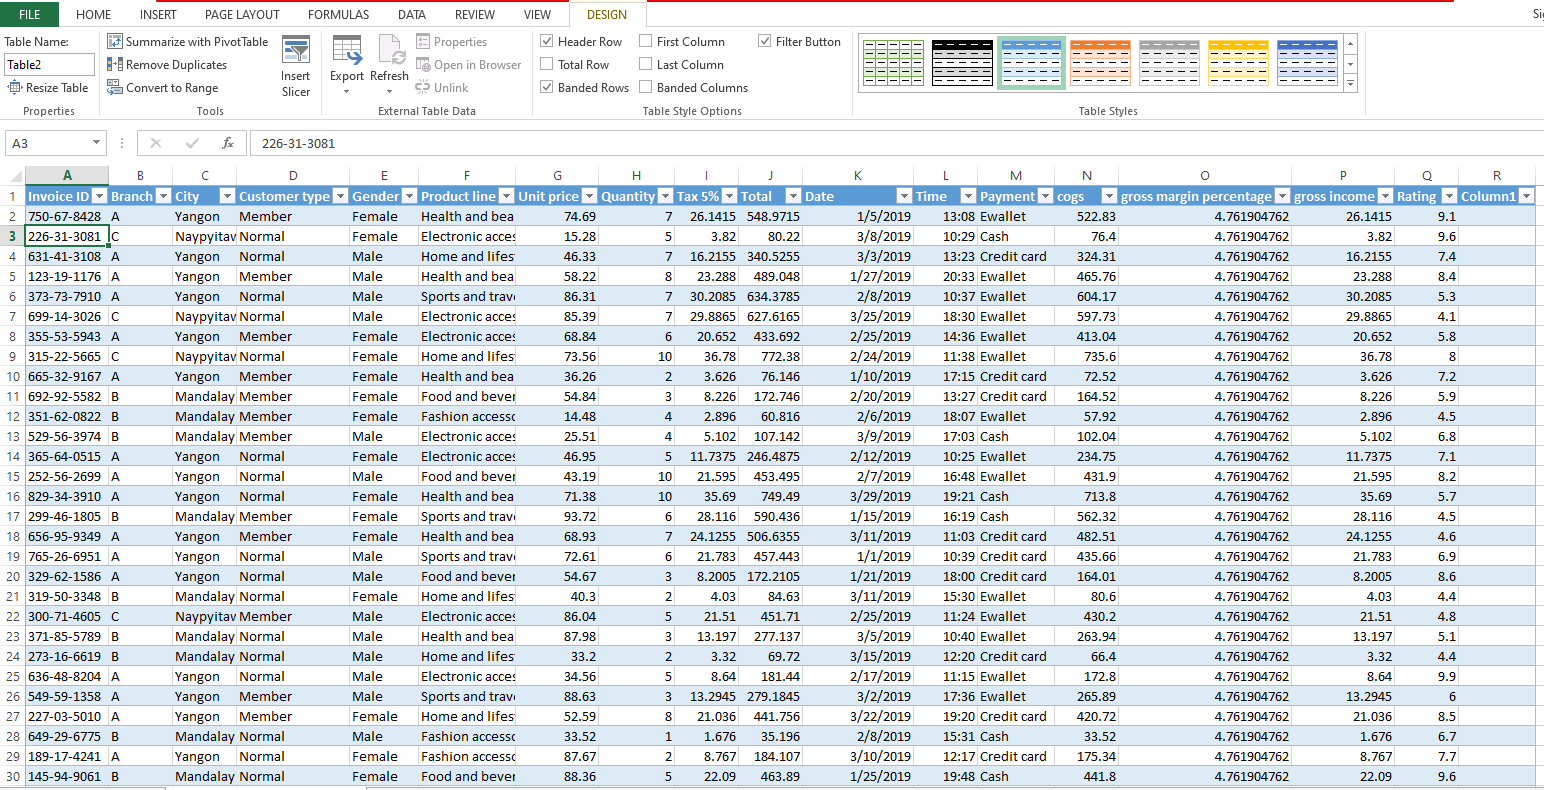
Excel tables allow you to analyze your data easily and quickly. To create a table from your data click any single cell in your data and then from the Insert tab in the Tables group, click Table. It automatically selects your data. Select My table has headers and click on OK.
It directly formatted the table for you and allows you to use many powerful features like sorting, filtering, calculating the total row at the end of the table by clicking on the checkbox Total Row in the Design tab. Using this not only gives you the total but you can also calculate Average, Count, Max, Min, Sum, Std deviation, etc.
What-If Analysis in Excel:
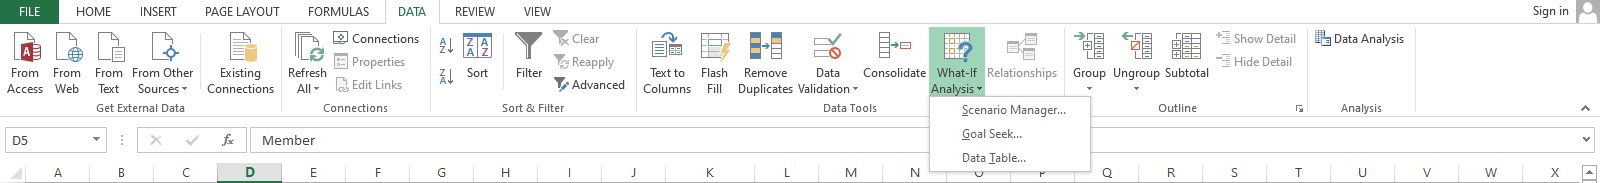
What-If Analysis in Excel allows you to change the different values in cells to see how those changes will affect the outcome of formulas. You can use its Goal Seek feature when you are not sure what input value the formula requires to get that result. To use this from the Data tab, in the Forecast group click on What-If Analysis.
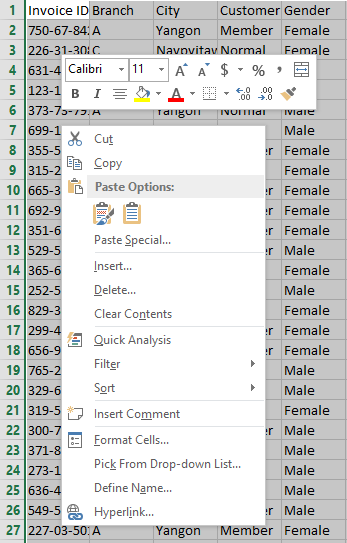
Quick Analysis in Excel:
With the Quick Analysis tool in Excel, you can quickly and easily analyze your data. To use this First select the data and then Right Click and select Quick Analysis from the menu which opens. You can directly perform Formatting like adding Data Bars, Color Scales, Icon Sets, highlight cells, etc. we can directly add pivot tables, insert sparklines, Charts, and also perform calculations like Average, Count, Max, Min, Sum, etc.
Excel Analysis ToolPak:
The Analysis ToolPak is an add-in that is included with Excel that provides data analysis tools. To add the Analysis ToolPak add-in follow the below steps:
1. Open File tab in Excel
2. Click on Options
3. In Excel, Options dialog box click on Add-ins
4. Select Analysis ToolPak from Add-ins and click on the Go
5. Select the checkbox for the Analysis ToolPak and click OK.
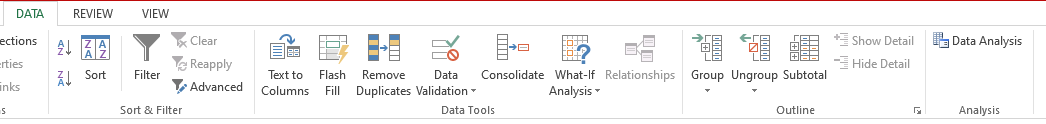
To access Analysis ToolPak Click on the Data tab and then from the Analysis group click On Data Analysis.
The Analysis ToolPak adds the following functionality to Excel:
· Anova: Single Factor
· Anova: Two-Factor with Replication
· Anova: Two-Factor Without Replication
· Correlation
· Covariance
· Descriptive Statistics analysis
· Exponential Smoothing analysis
· F-Test Two-Sample for Variances
· Fourier Analysis
· Histogram
· Moving Average analysis
· Random Number Generation analysis
· Rank and Percentile analysis
· Regression analysis
· Sampling
· t-Test: Paired Two Sample For Means
· t-Test: Two-Sample Assuming Equal Variances
· t-Test: Two-Sample Assuming Unequal Variances
· z-Test: Two-Sample for Means
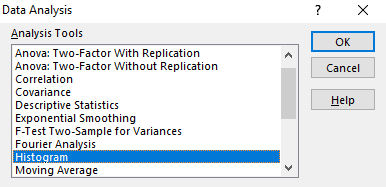
The below figure shows the dialog box for Data Analysis.
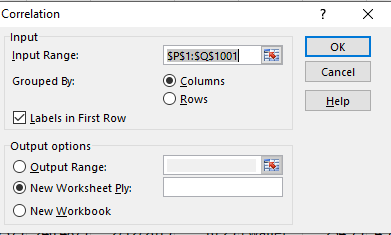
Correlation:
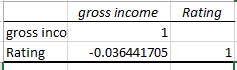
If we want to find out if there is any correlation between columns Gross Income and Rating. First, select the correlation option from Data Analysis. Then in the correlation dialog box select both Gross Income and Rating columns in the Input Range. Then Click on OK. The correlation coefficient has a value between -1 and +1. From this, we can know how strongly two variables are related. Value 1 indicates a perfect positive correlation. From the output shown below, we can say that there is no correlation between Rating and gross income.
Descriptive Statistics:
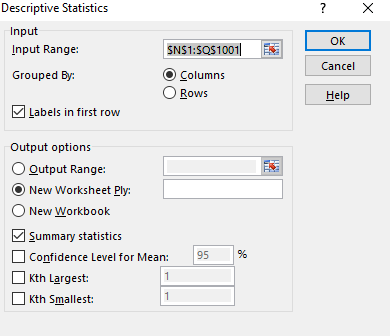
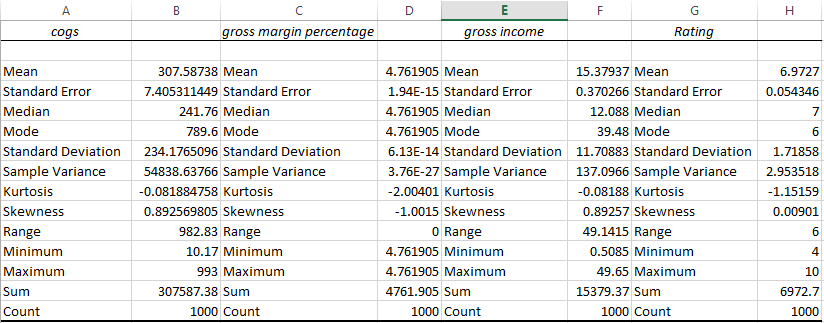
If we want to calculate Descriptive Statistics for any numeric column then first select the Descriptive Statistics option from Data Analysis. Then in the Descriptive Statistics dialog box select columns (for example cogs, gross margin percentage, gross income, Rating) in Input Range. Then Click on OK.
Descriptive Statistics directly calculates Mean, Standard Error, Median, Mode, Standard Deviation, Sample Variance, Kurtosis, Skewness, Range, Minimum, Maximum, Sum, and Count for selected columns. Output for this example is shown below.
Histogram:
If you want to know the distribution of customer ratings, you can use a histogram for that. First, select the histogram option from Data Analysis. Then in the histogram dialog box select the rating column in the Input range and for the Bin range create a range according to your need. We created Bin range from 1 to 10 and select it in Bin range. Click on Chart output and then Ok. It creates a histogram display below. In this histogram add Trend Line. To add a trend line go to Design –> Add Chart Element –> Trendline. From this, we can say that customer rating has a normal distribution.
Other tools for data analysis:
There are many data analysis tools available nowadays, but which one is best to analyze our data depends on what type and how much data do we need to analyze, budget, and time available for analysis.
Here is a list of some of the best data analytics tools available Other than Excel.
1. Python:
Python is an open-source, high-level programming language. For data analysis, it provides a large set of libraries like Pandas, Numpy, SciPy, and scikit-learn, etc. It also provides many data visualization packages like Matplotlib, Plotly, and Seaborn, etc. it is the most preferred language for machine learning and data science.
2. Tableau:
Tableau is a powerful analytics and data visualization platform that allows users to create reports, interactive dashboards that represent data in the most user-friendly way. It can run on the cloud or on-premises.
3. Microsoft Power BI:
Microsoft Power BI is a top business intelligence platform it makes it easy for businesses to spot trends, patterns, and insights across large sets of data. It supports many types of data sources. It also provides reports, visualizations, and dashboards for data.
4. R:
R is an open-source programming language. It is best at exploratory data analysis, predictive analyses, and statistical analysis. Such as distributions, clustering classification, and regression analysis. It is used for building your own data analysis tools.
5. Qlik:
Qlik offers in-memory data processing for fast results and data visualization. It can also run on the cloud or on-premises. It offers helpful tools support for data exploration and discovery by technical and non-technical users alike.
6. KNIME:
KNIME stands for the Konstanz Information Miner. It is a free, open-source platform to perform data integration, processing, visualization, and reporting. It builds advanced machine learning and data mining solutions with minimal or no programming requirements.
Conclusion:
Here are some general insights about the data that we find from our data analysis.
The number of gross income is very similar in all Branches with a slight superiority in Branch C. Women use to generate sales with a higher gross income than men. Customer rating has a normal distribution. The Credit Card is the payment method less used. There is no correlation between Rating and gross income.
Always perform data cleaning and data validation before Data analysis if data are not in proper format otherwise it leads your data analysis in the wrong direction.


