
Year 2013 is about to end by tomorrow. So which assest class among
Index,Commodities,Forex performed good for this year? Below infographic
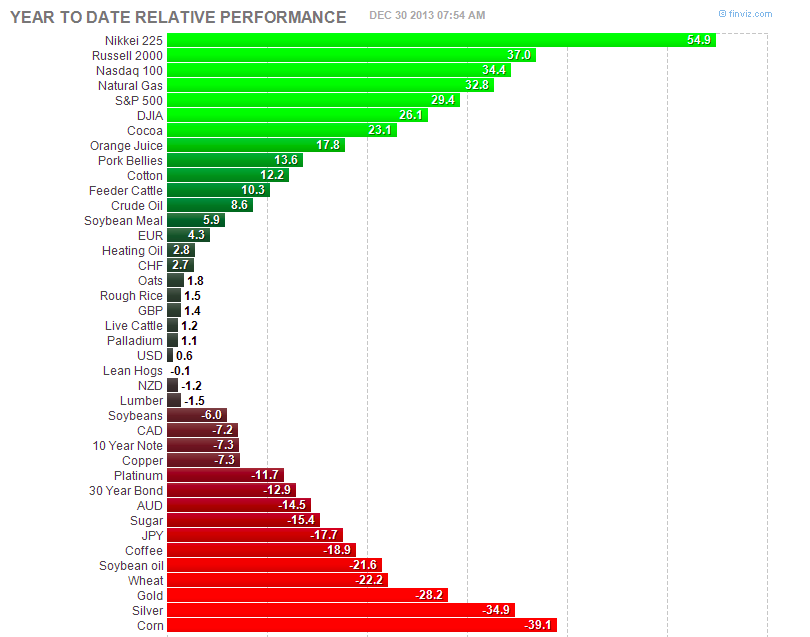
shows the year to date performance of various asset classes ( World
Indices, International Commodities and Currency Pairs).
[source :finviz]
Key Facts from the infographic
1)Nikkei is the top performer amount various asset classes gained 54.9 and corn among the worst performer and lost 39.1 among the asset classes
2)Most of the world stock market indices(Nikkei, Russel2000, Nasdaq100,S&P500) are the Top Index performers
3)Natural Gas is the top performing commodity with 29.4% YTD returns
4)Both Gold and Silver lost in double digit percentage terms. This year is the first year since 1997 that gold will finish with a double-digit drop. lost 28.2% and 34.1 respectively.
5)Among the forex pairs EURUSD is the top performer with 4.3% and USDJPY lost nearly 17.7% and the worst forex pair performer among the most traded currency pairs.
6)10 year bond and 30 year Bond are the losers for the year 2013 with negative returns of 7.3 and 12.9% returns respectively


No comments:
Post a Comment